Oracle · Management Cloud
Simplifying server resource utilization.
- Problem Server Resource Analytics gave admins rich telemetry across CPU, memory, and storage, but it was a wall of metrics, hard to read at a glance or act on with confidence.
- Solution Turned dense telemetry into an at-a-glance dashboard, an inverted-pyramid hierarchy that surfaces what's wasted or about to tip over in seconds.

Impact at a glance
- Adopted across the platform Several interaction patterns from this work spread across the broader Oracle Management Cloud.
- Well received by admins Landed with customers managing large, messy server estates, the audience it was tuned for.
- Lead interaction designer Owned the end-to-end interaction model for Server Resource Analytics.
My role
Lead Interaction Designer.
I led the design of Server Resource Analytics, owning the interaction model end-to-end and partnering closely with product, engineering, and domain experts.
Context & challenge
An integrated cloud, a very specific IT problem.
Oracle Management Cloud is an integrated cloud platform, and IT Analytics is one of its core services. Inside IT Analytics, Server Resource Analytics is the application capacity managers and system administrators rely on to manage their server estate, answering questions like "what's being wasted?" and "what's about to tip over?"
The data was rich and the use cases were dense. The challenge was turning a wall of metrics into something a busy admin could read in seconds and act on with confidence.

Getting familiar with the content
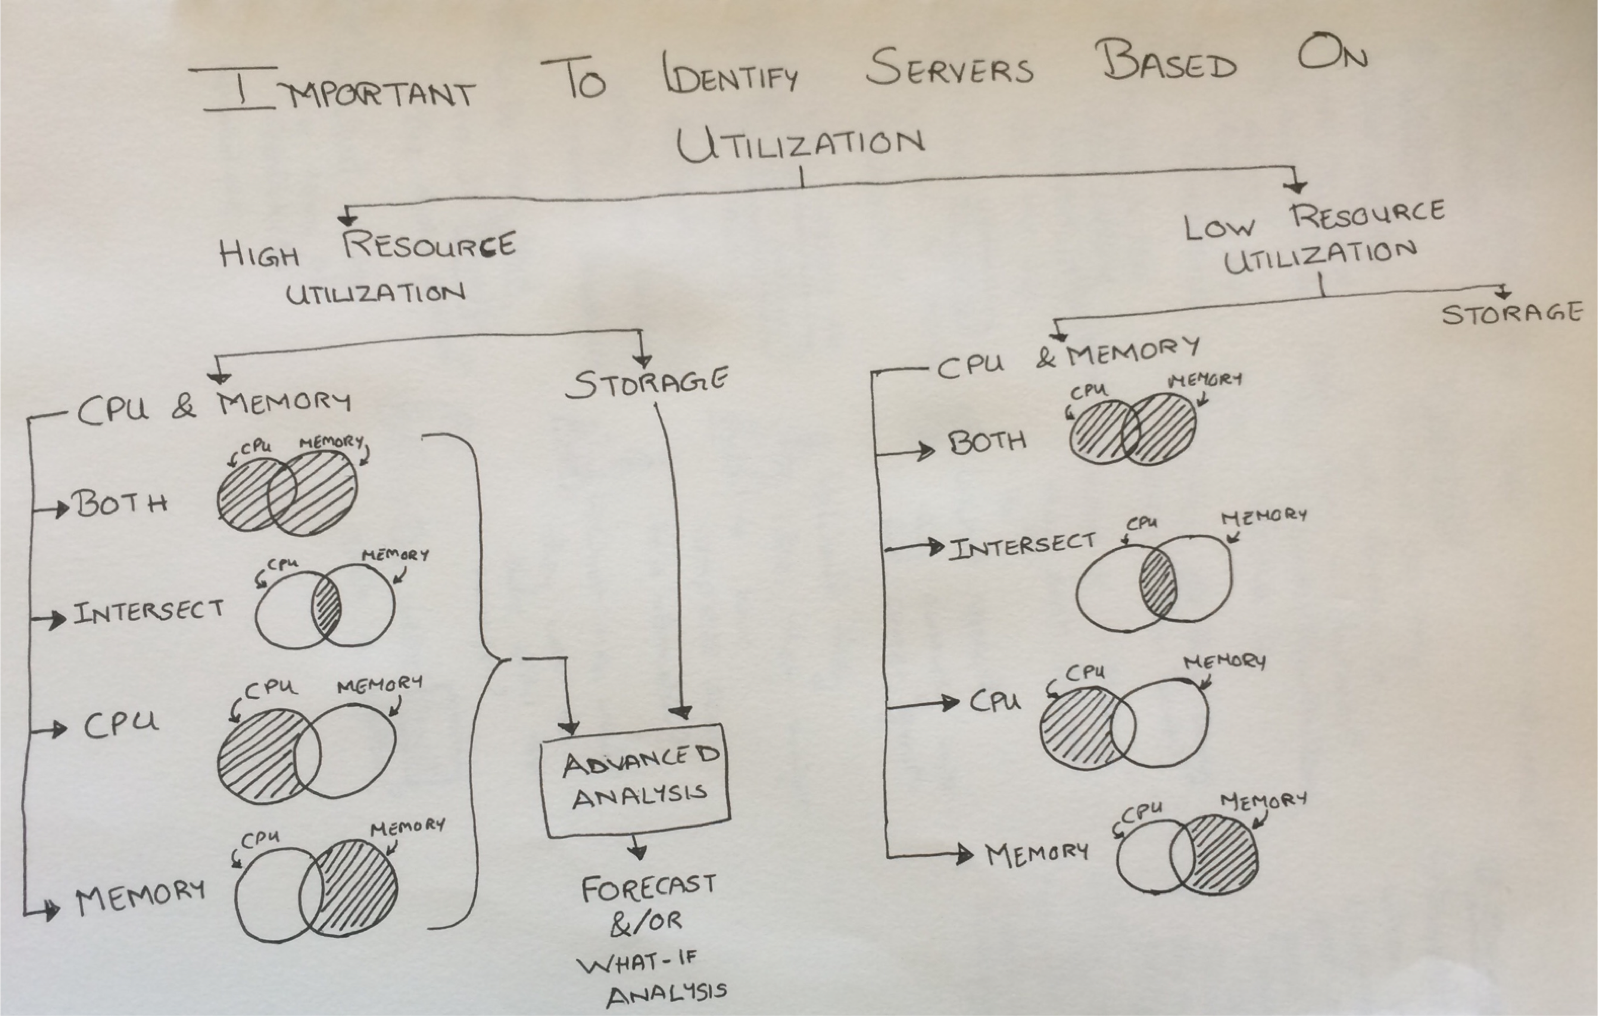
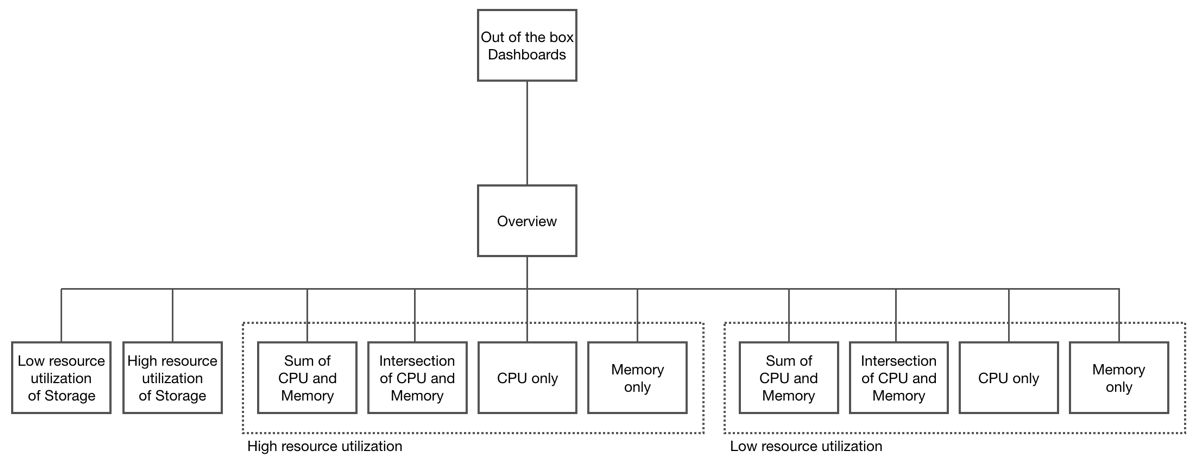
Three resources. Two that mattered most.
CPU, memory, and storage utilization were all in scope. But CPU and memory carried the most weight; their capacity constraints and usage patterns made them the metrics that most often drove real decisions. Letting that hierarchy show up in the design was an early, important call.
"Don't overwhelm the user with everything at once; reveal it in the order they actually need it."
Ideation
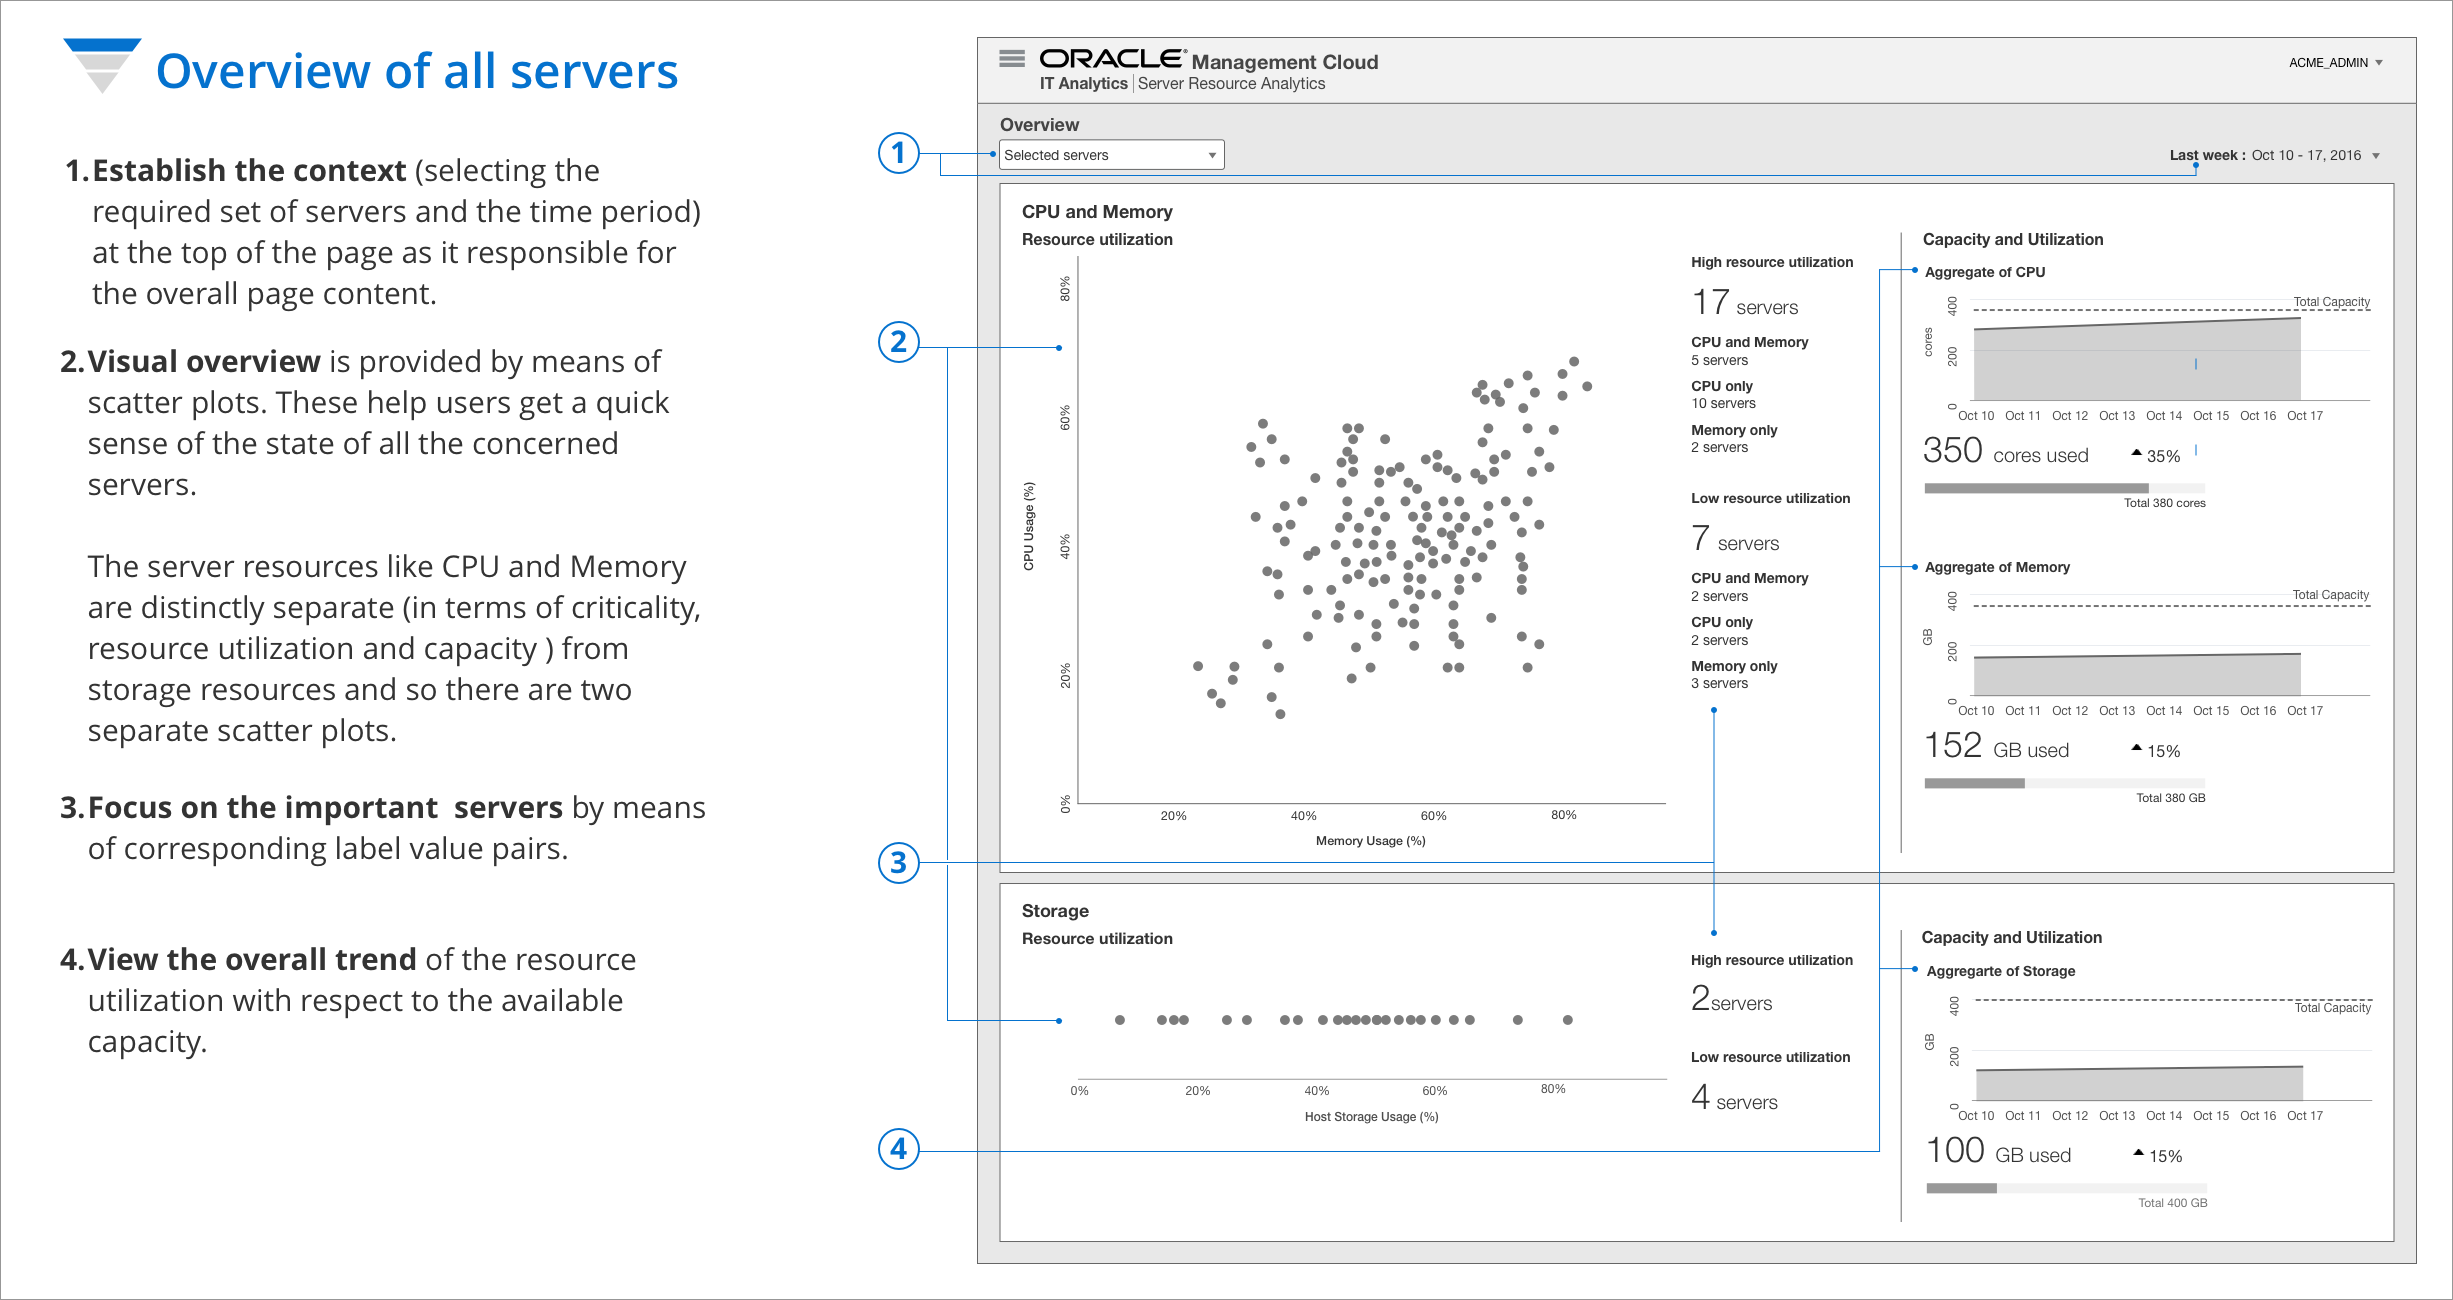
An inverted pyramid of information.
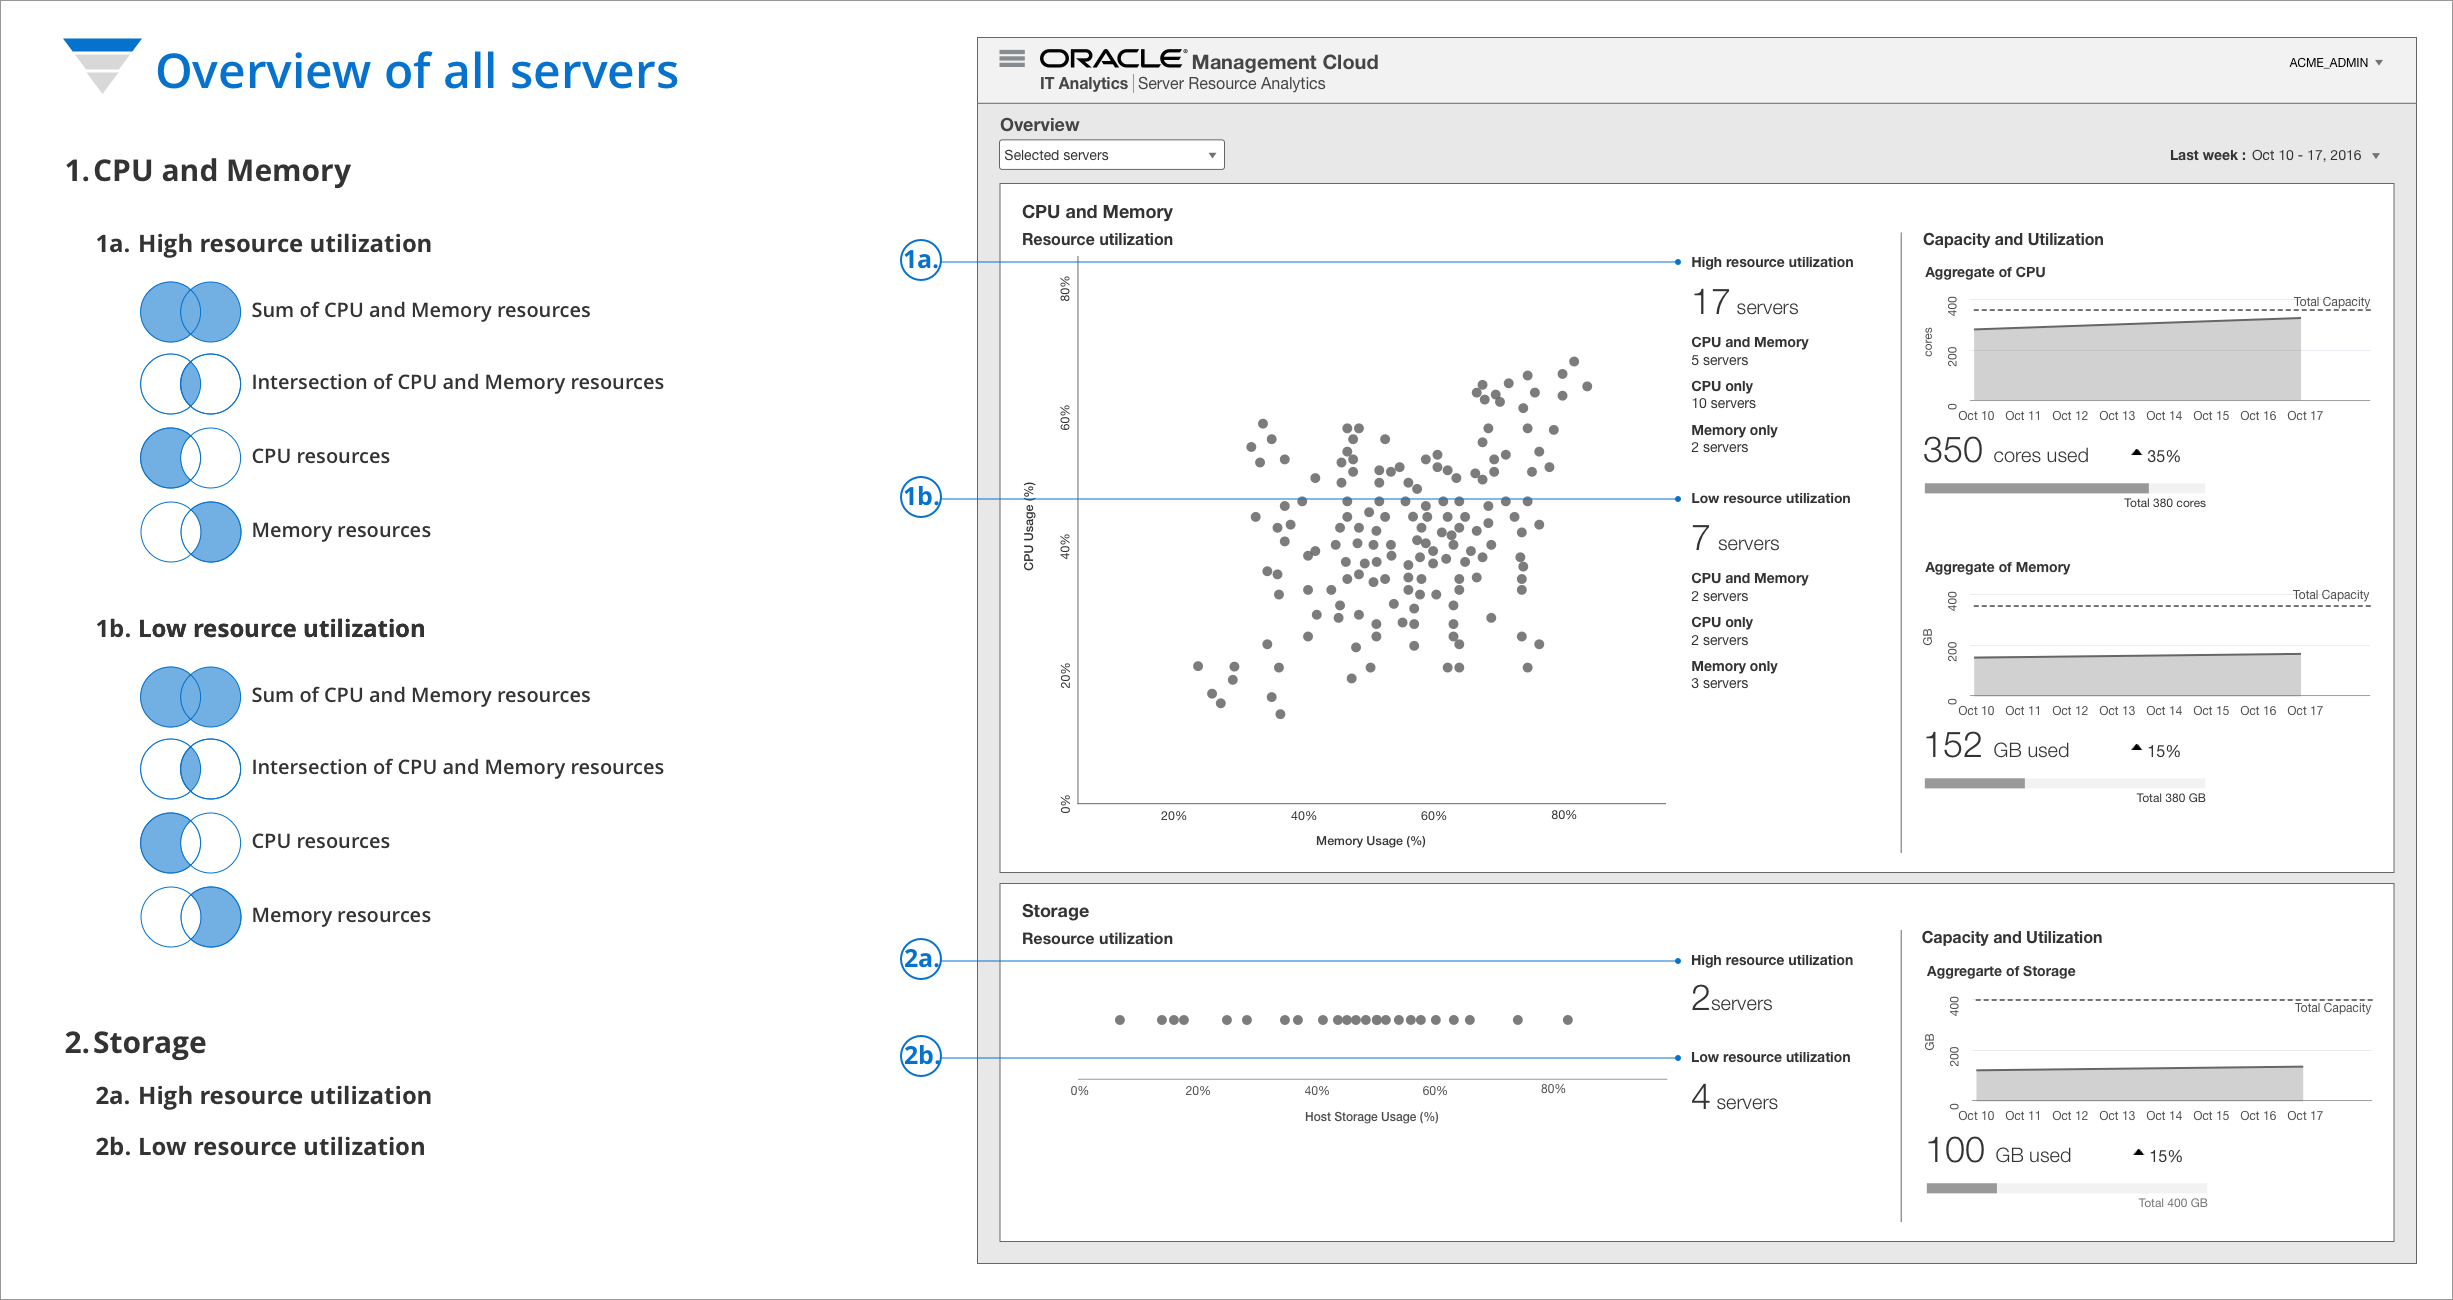
To keep a complex application from feeling overwhelming, I structured the experience around progressive disclosure, specifically, an inverted-pyramid approach with three stages:
- The headline. A top-level read on resource health across the estate.
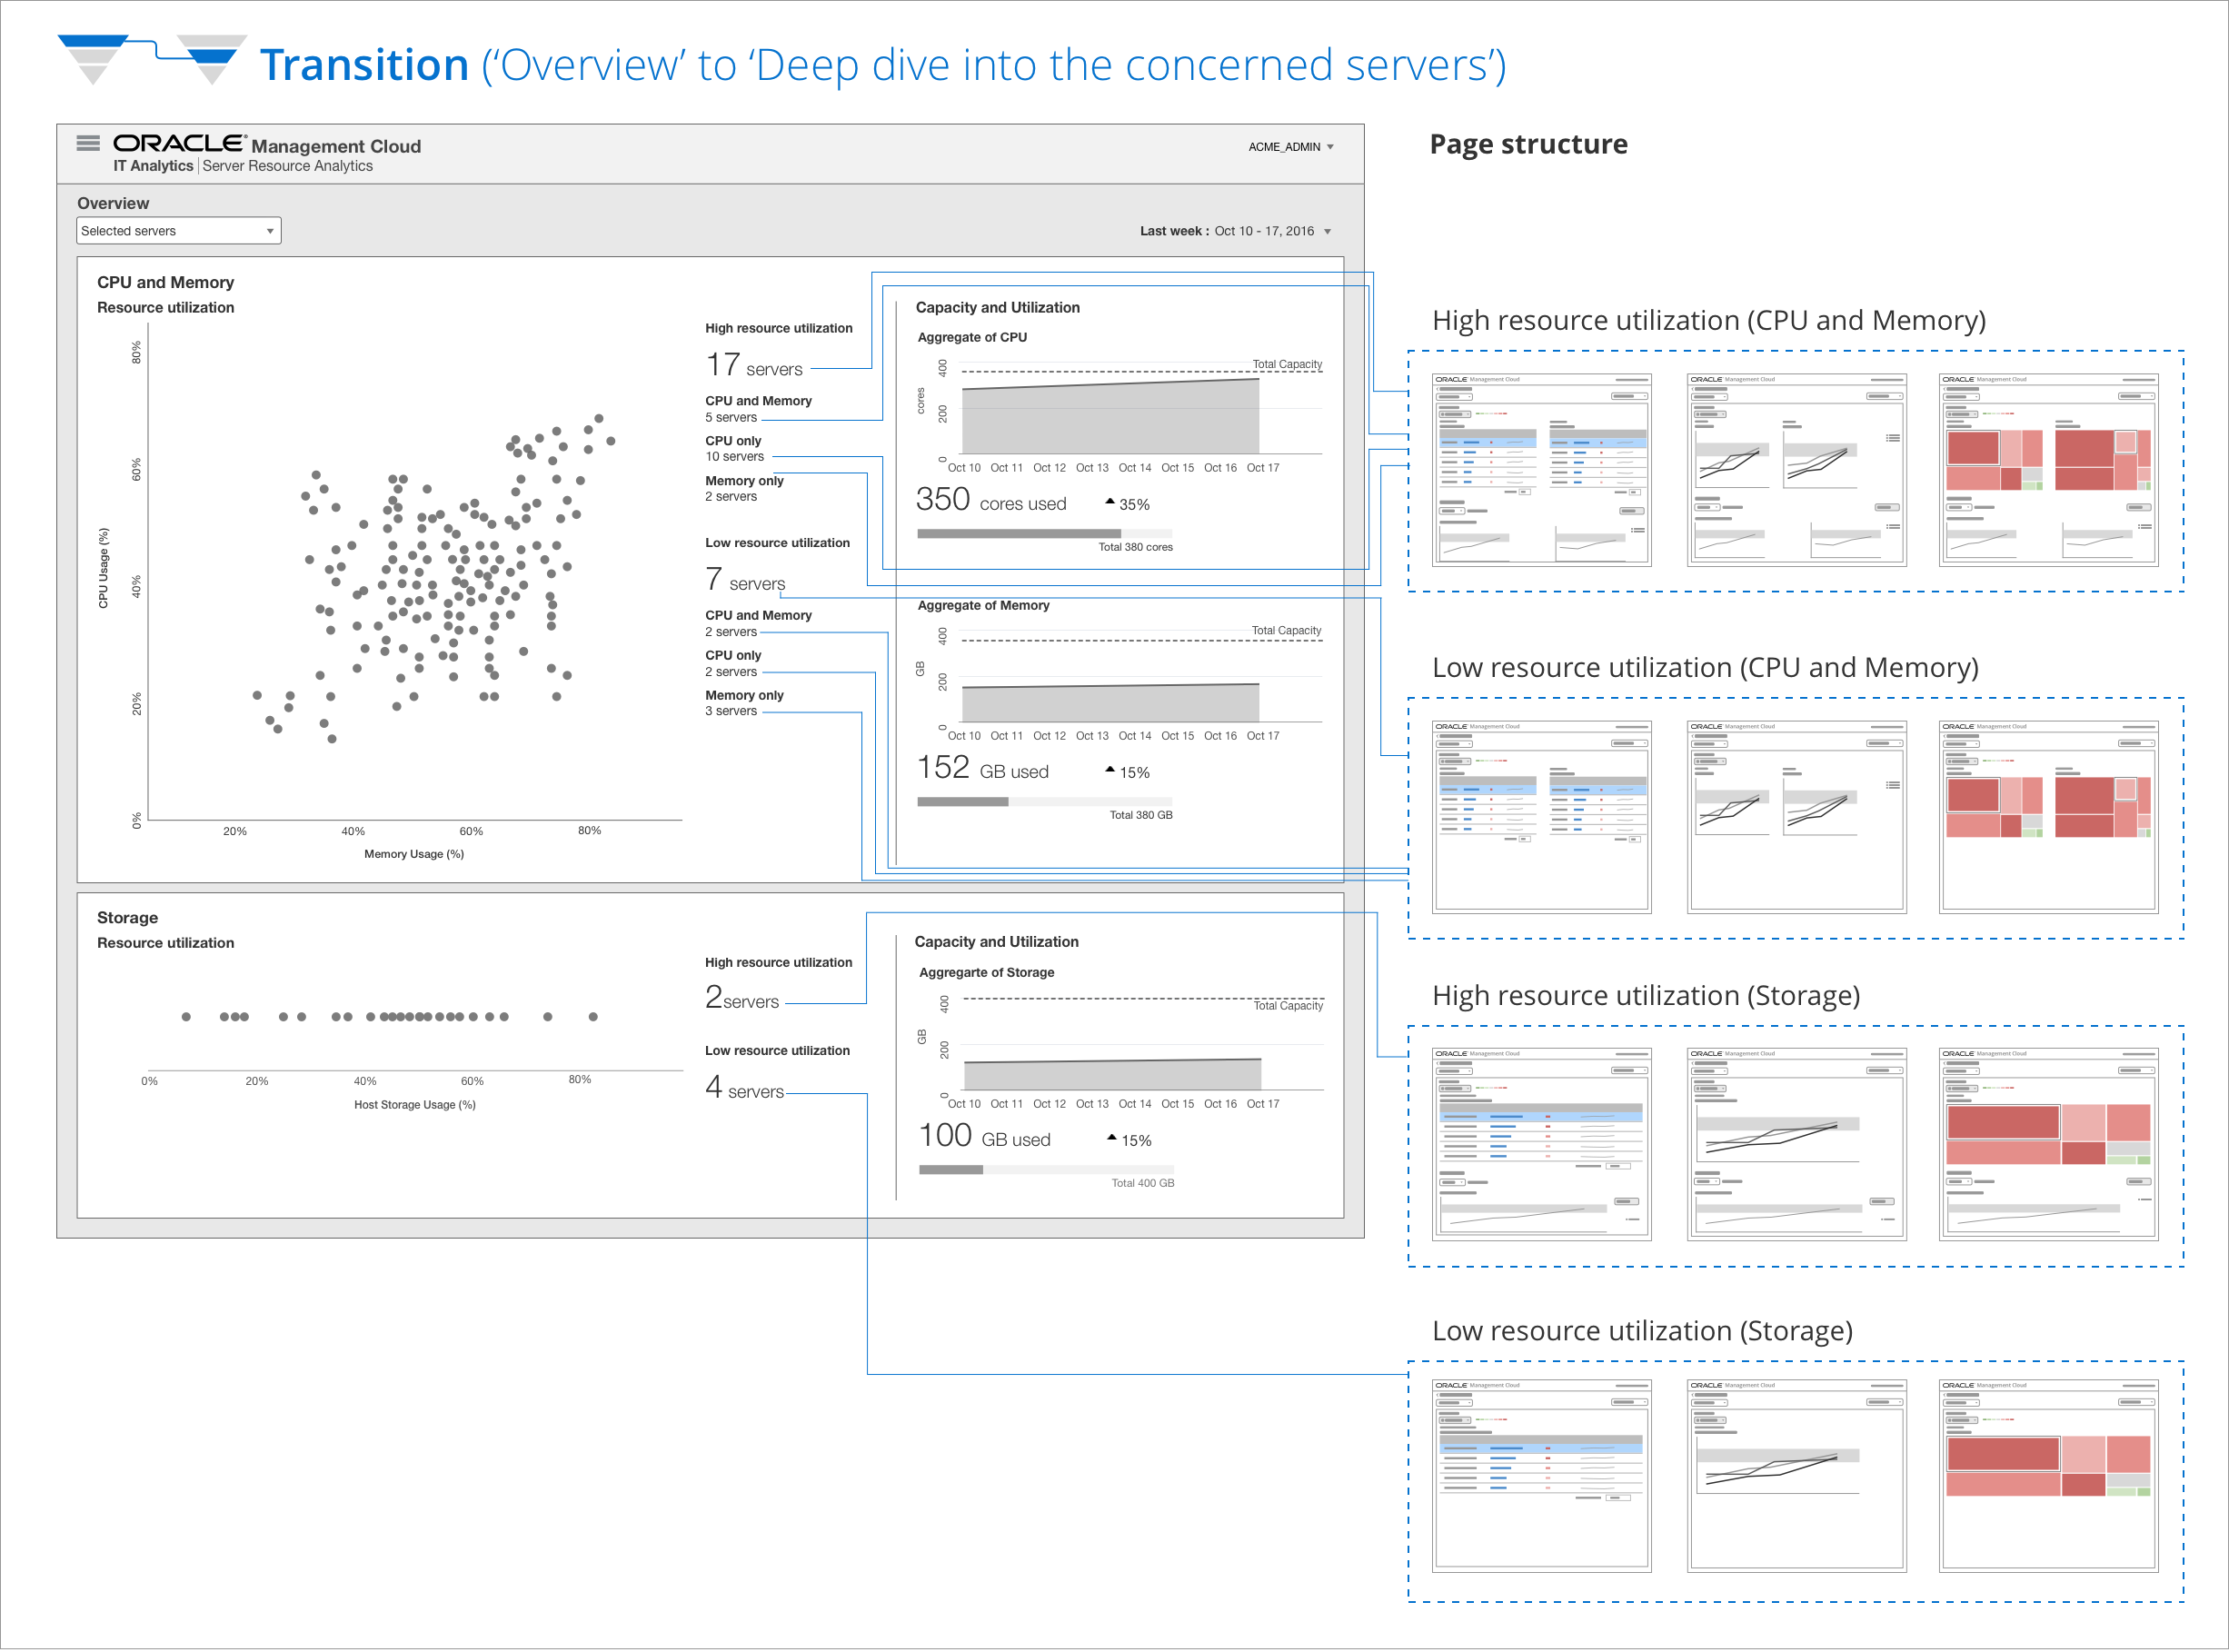
- The breakdown. Pivots into the dimensions that matter, CPU, memory, time, group.
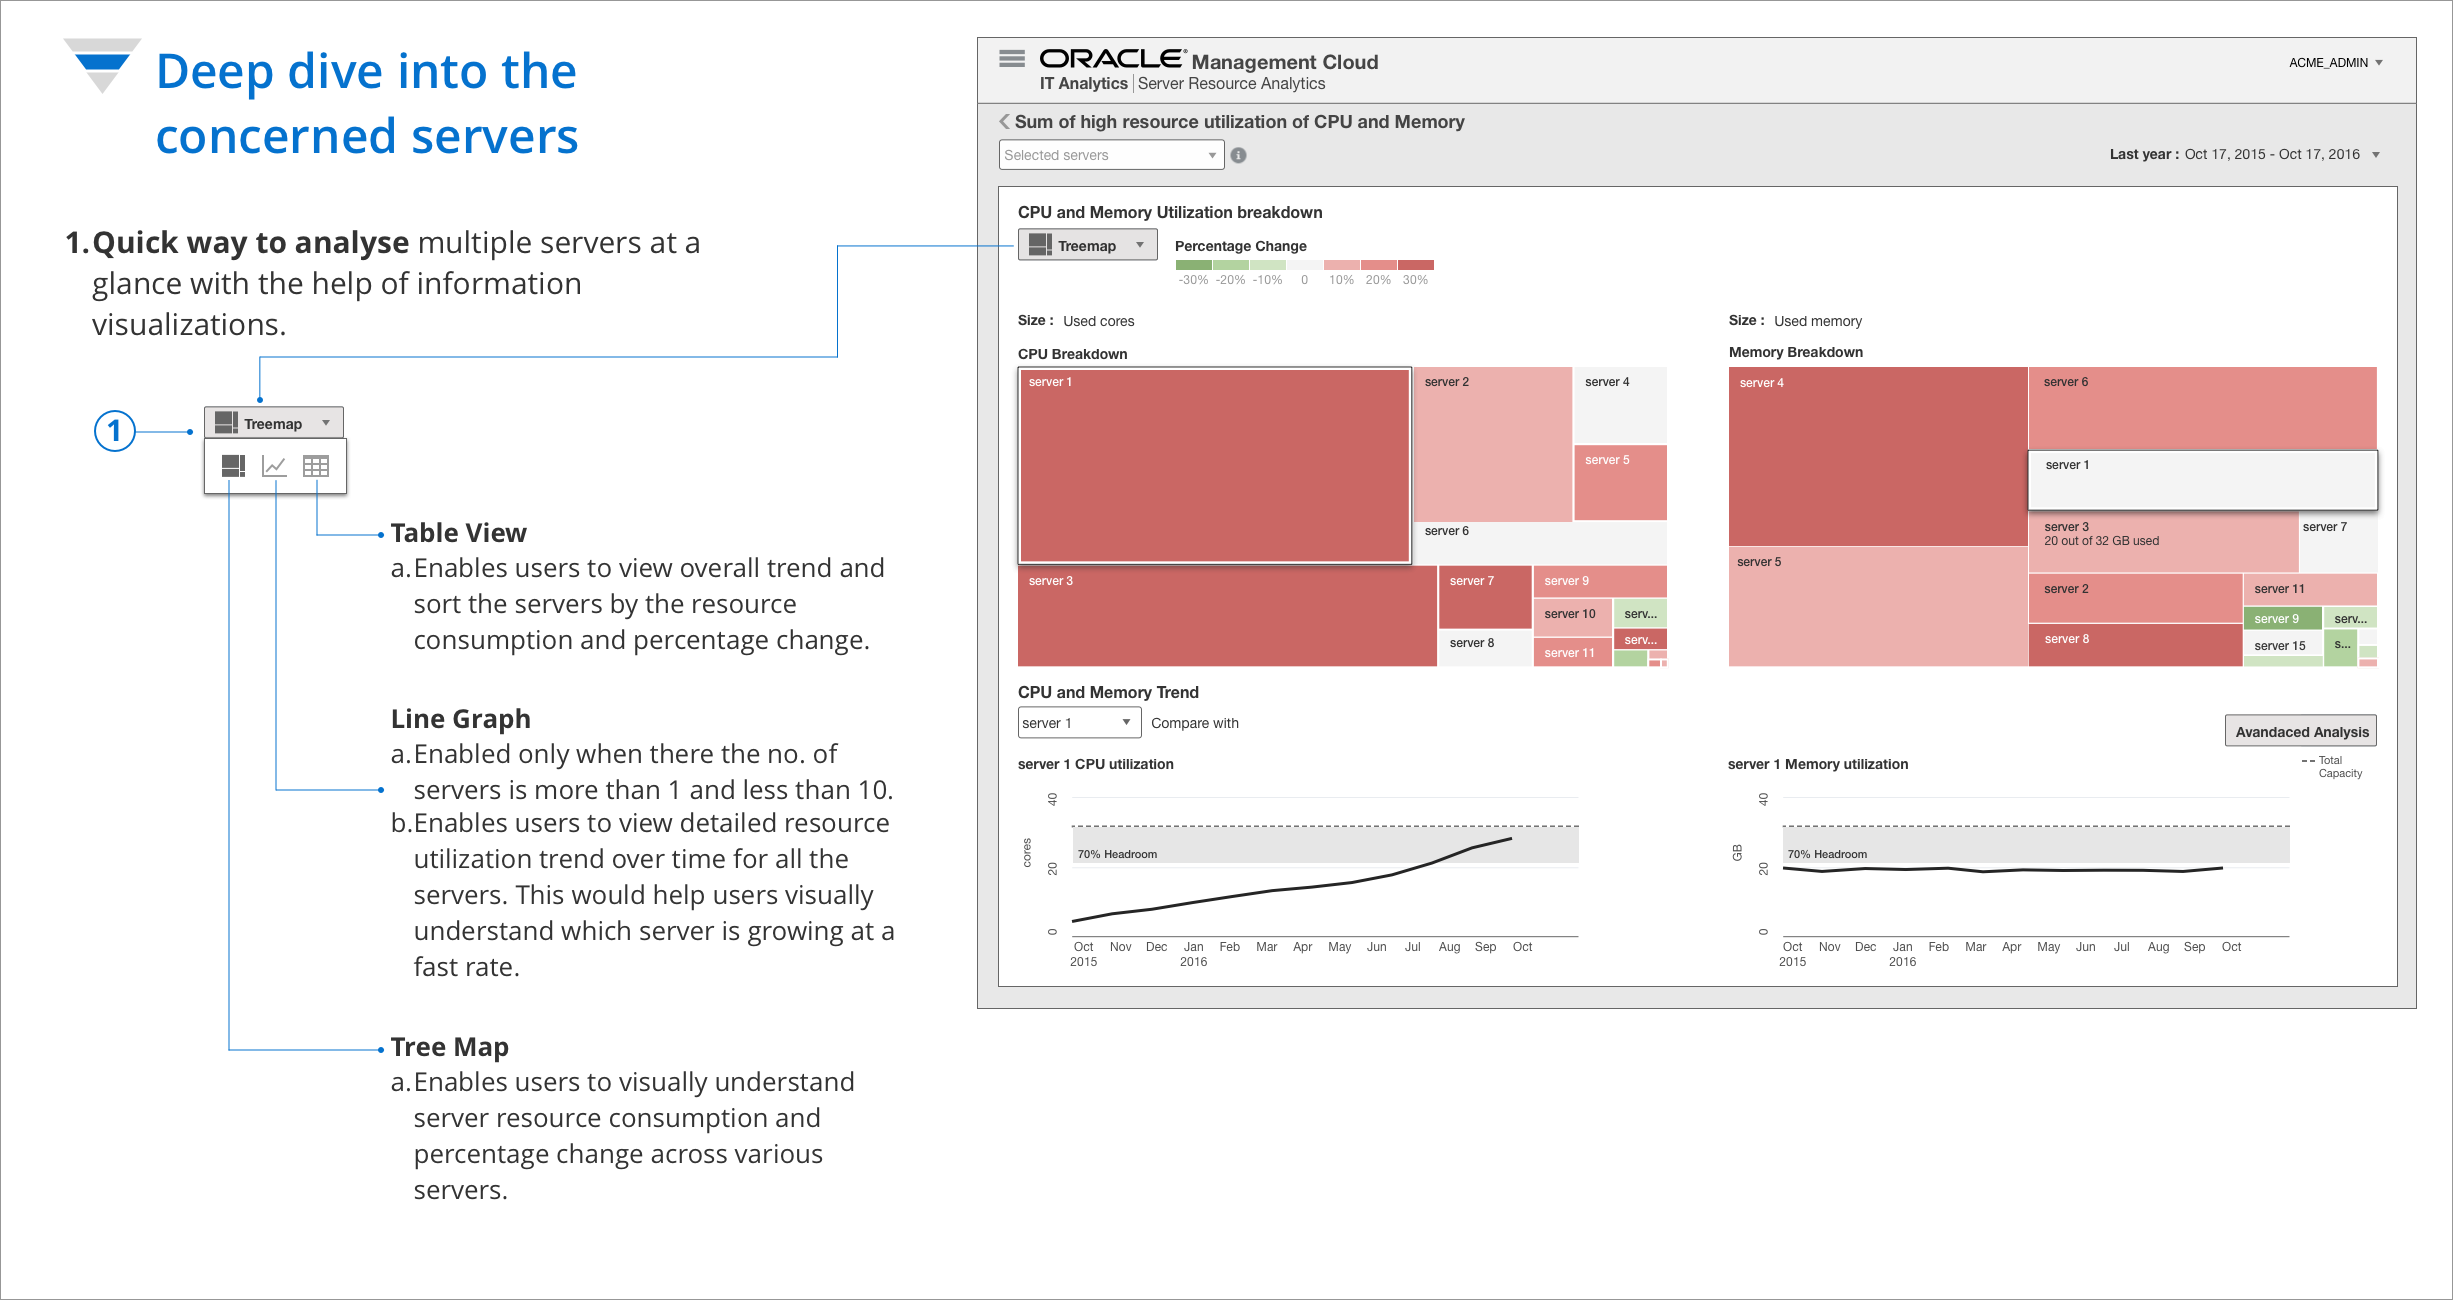
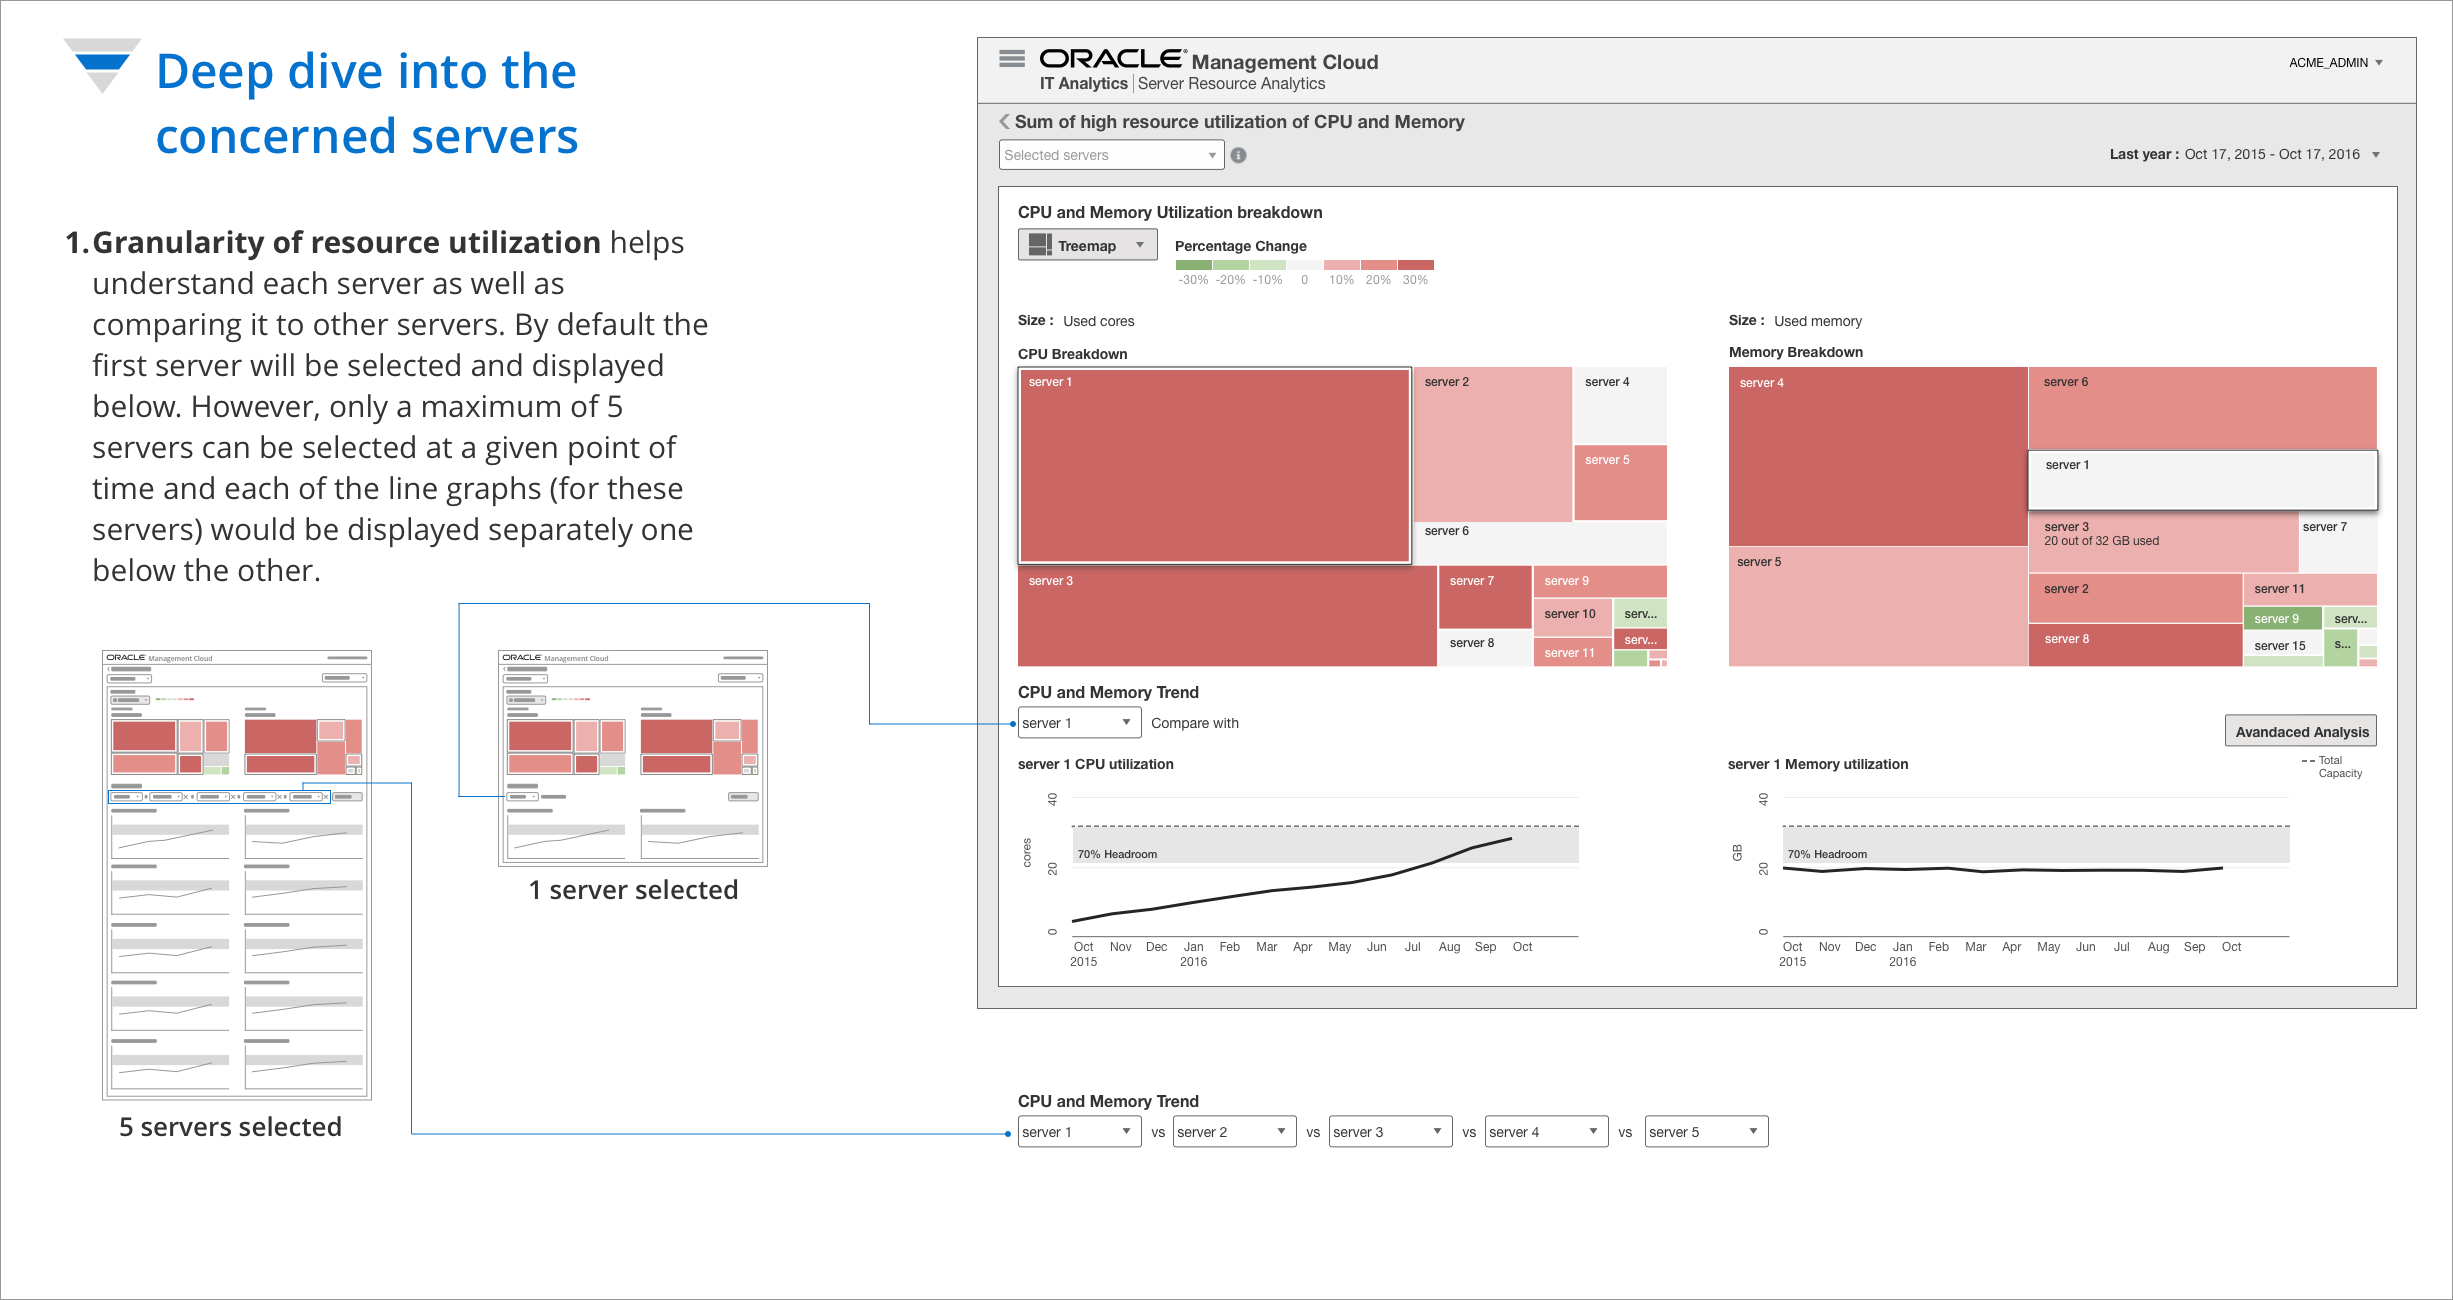
- The detail. Server- and metric-level depth for the moment a decision actually has to be made.

Final designs
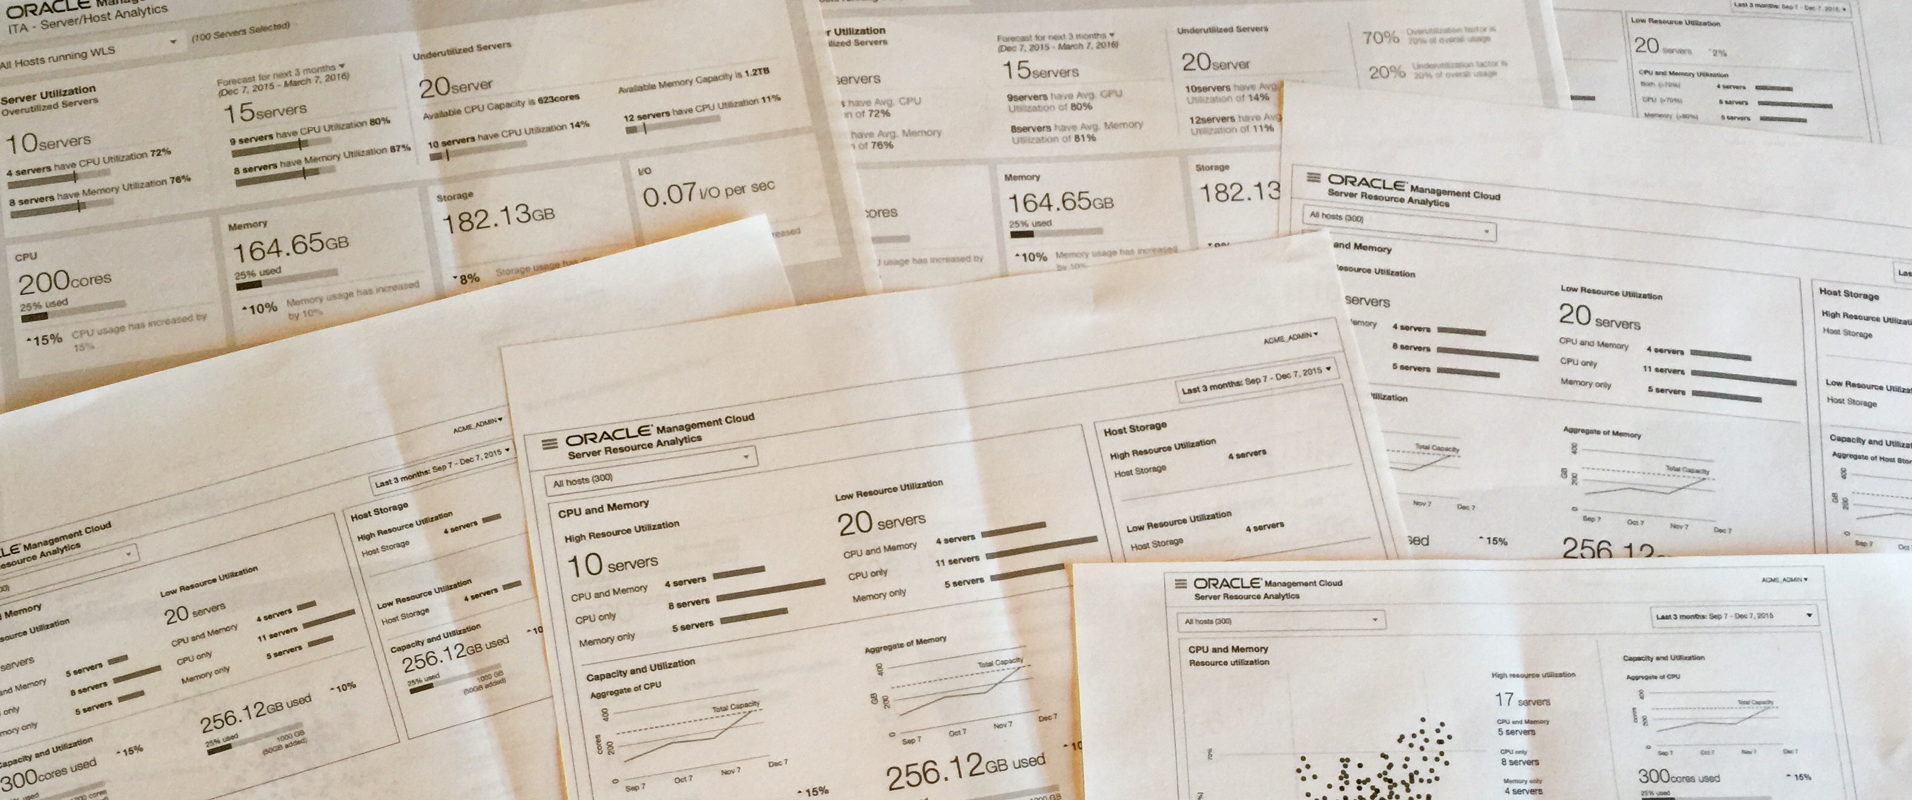
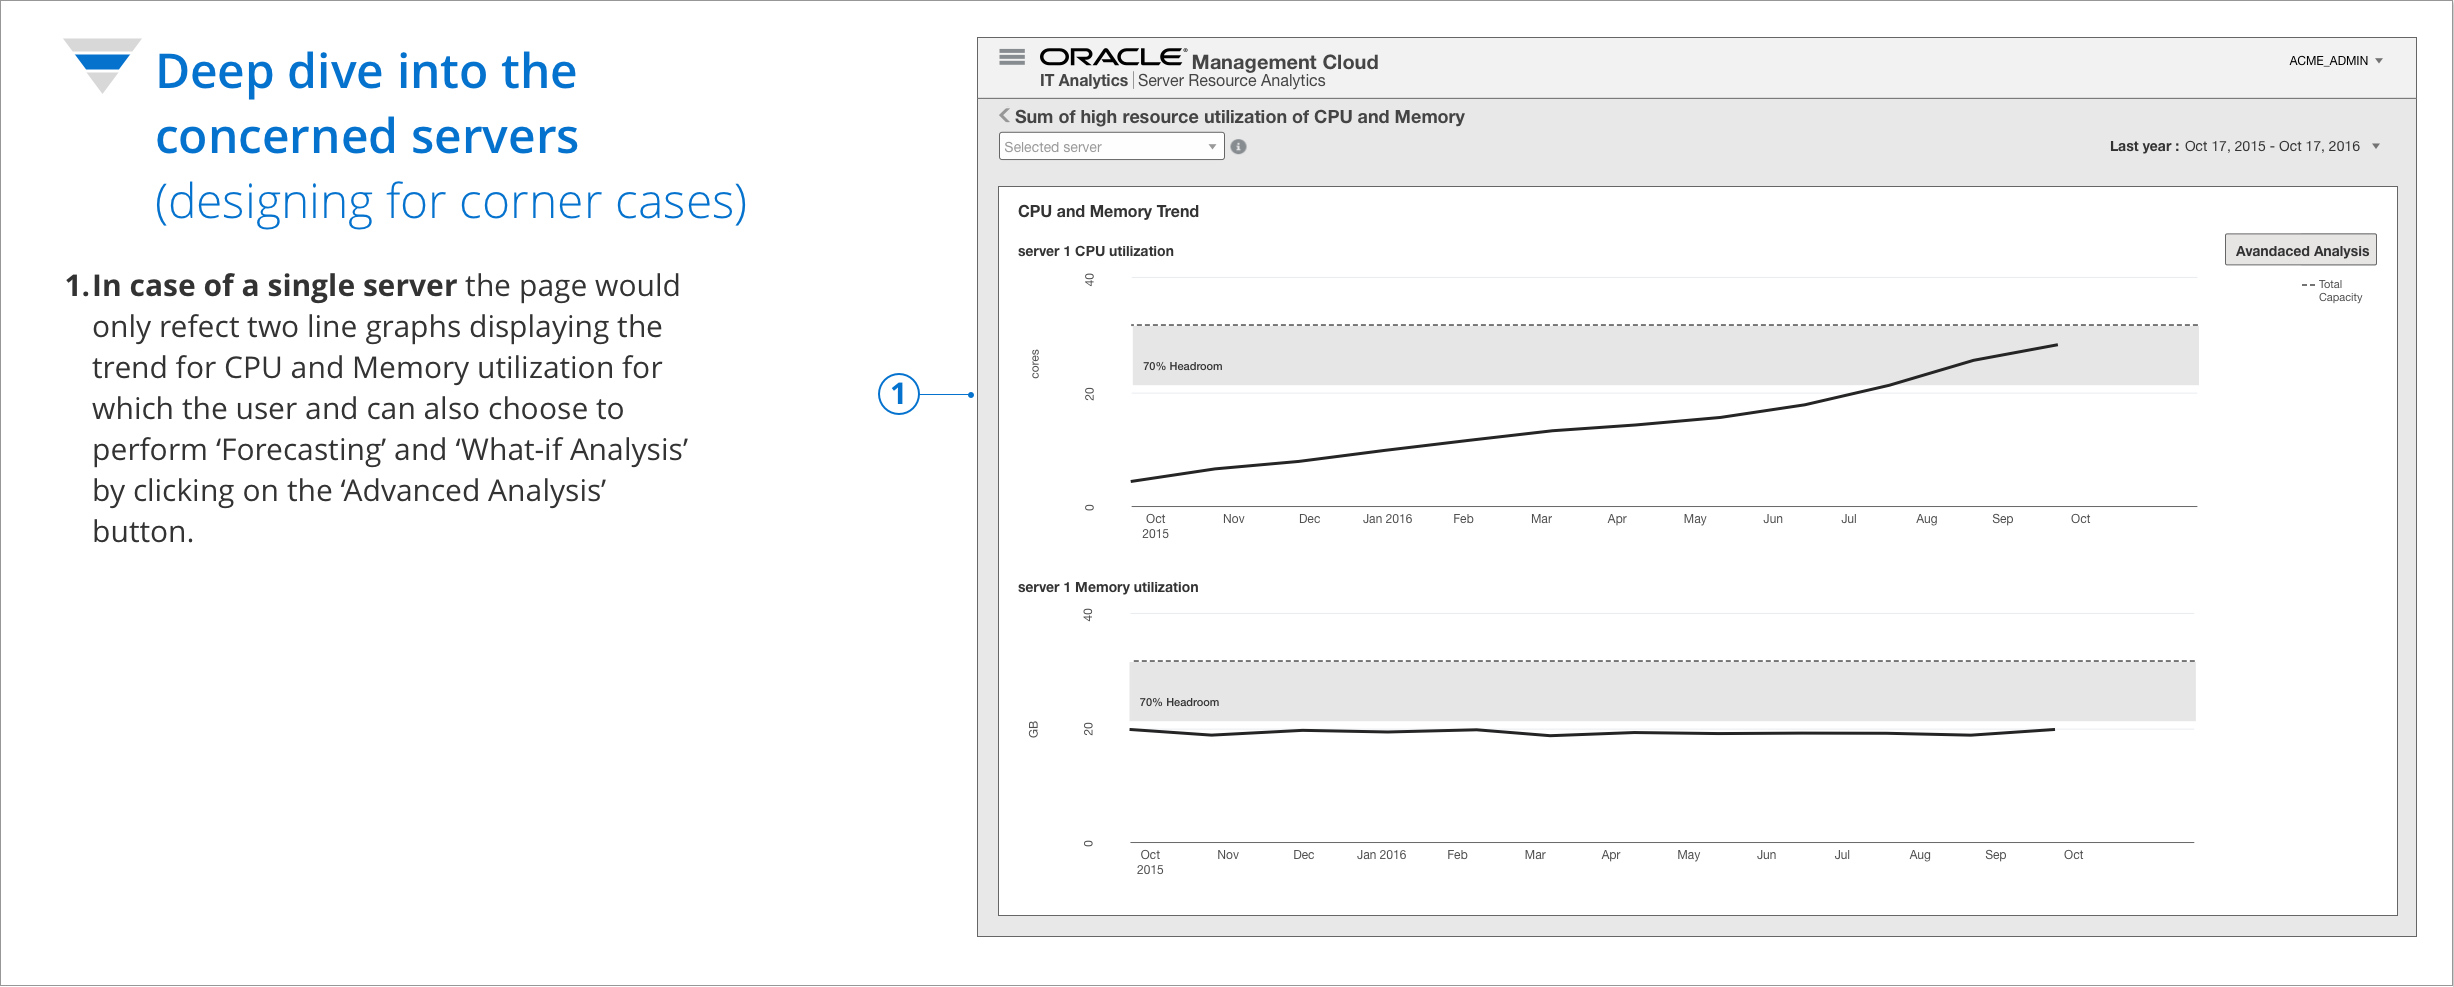
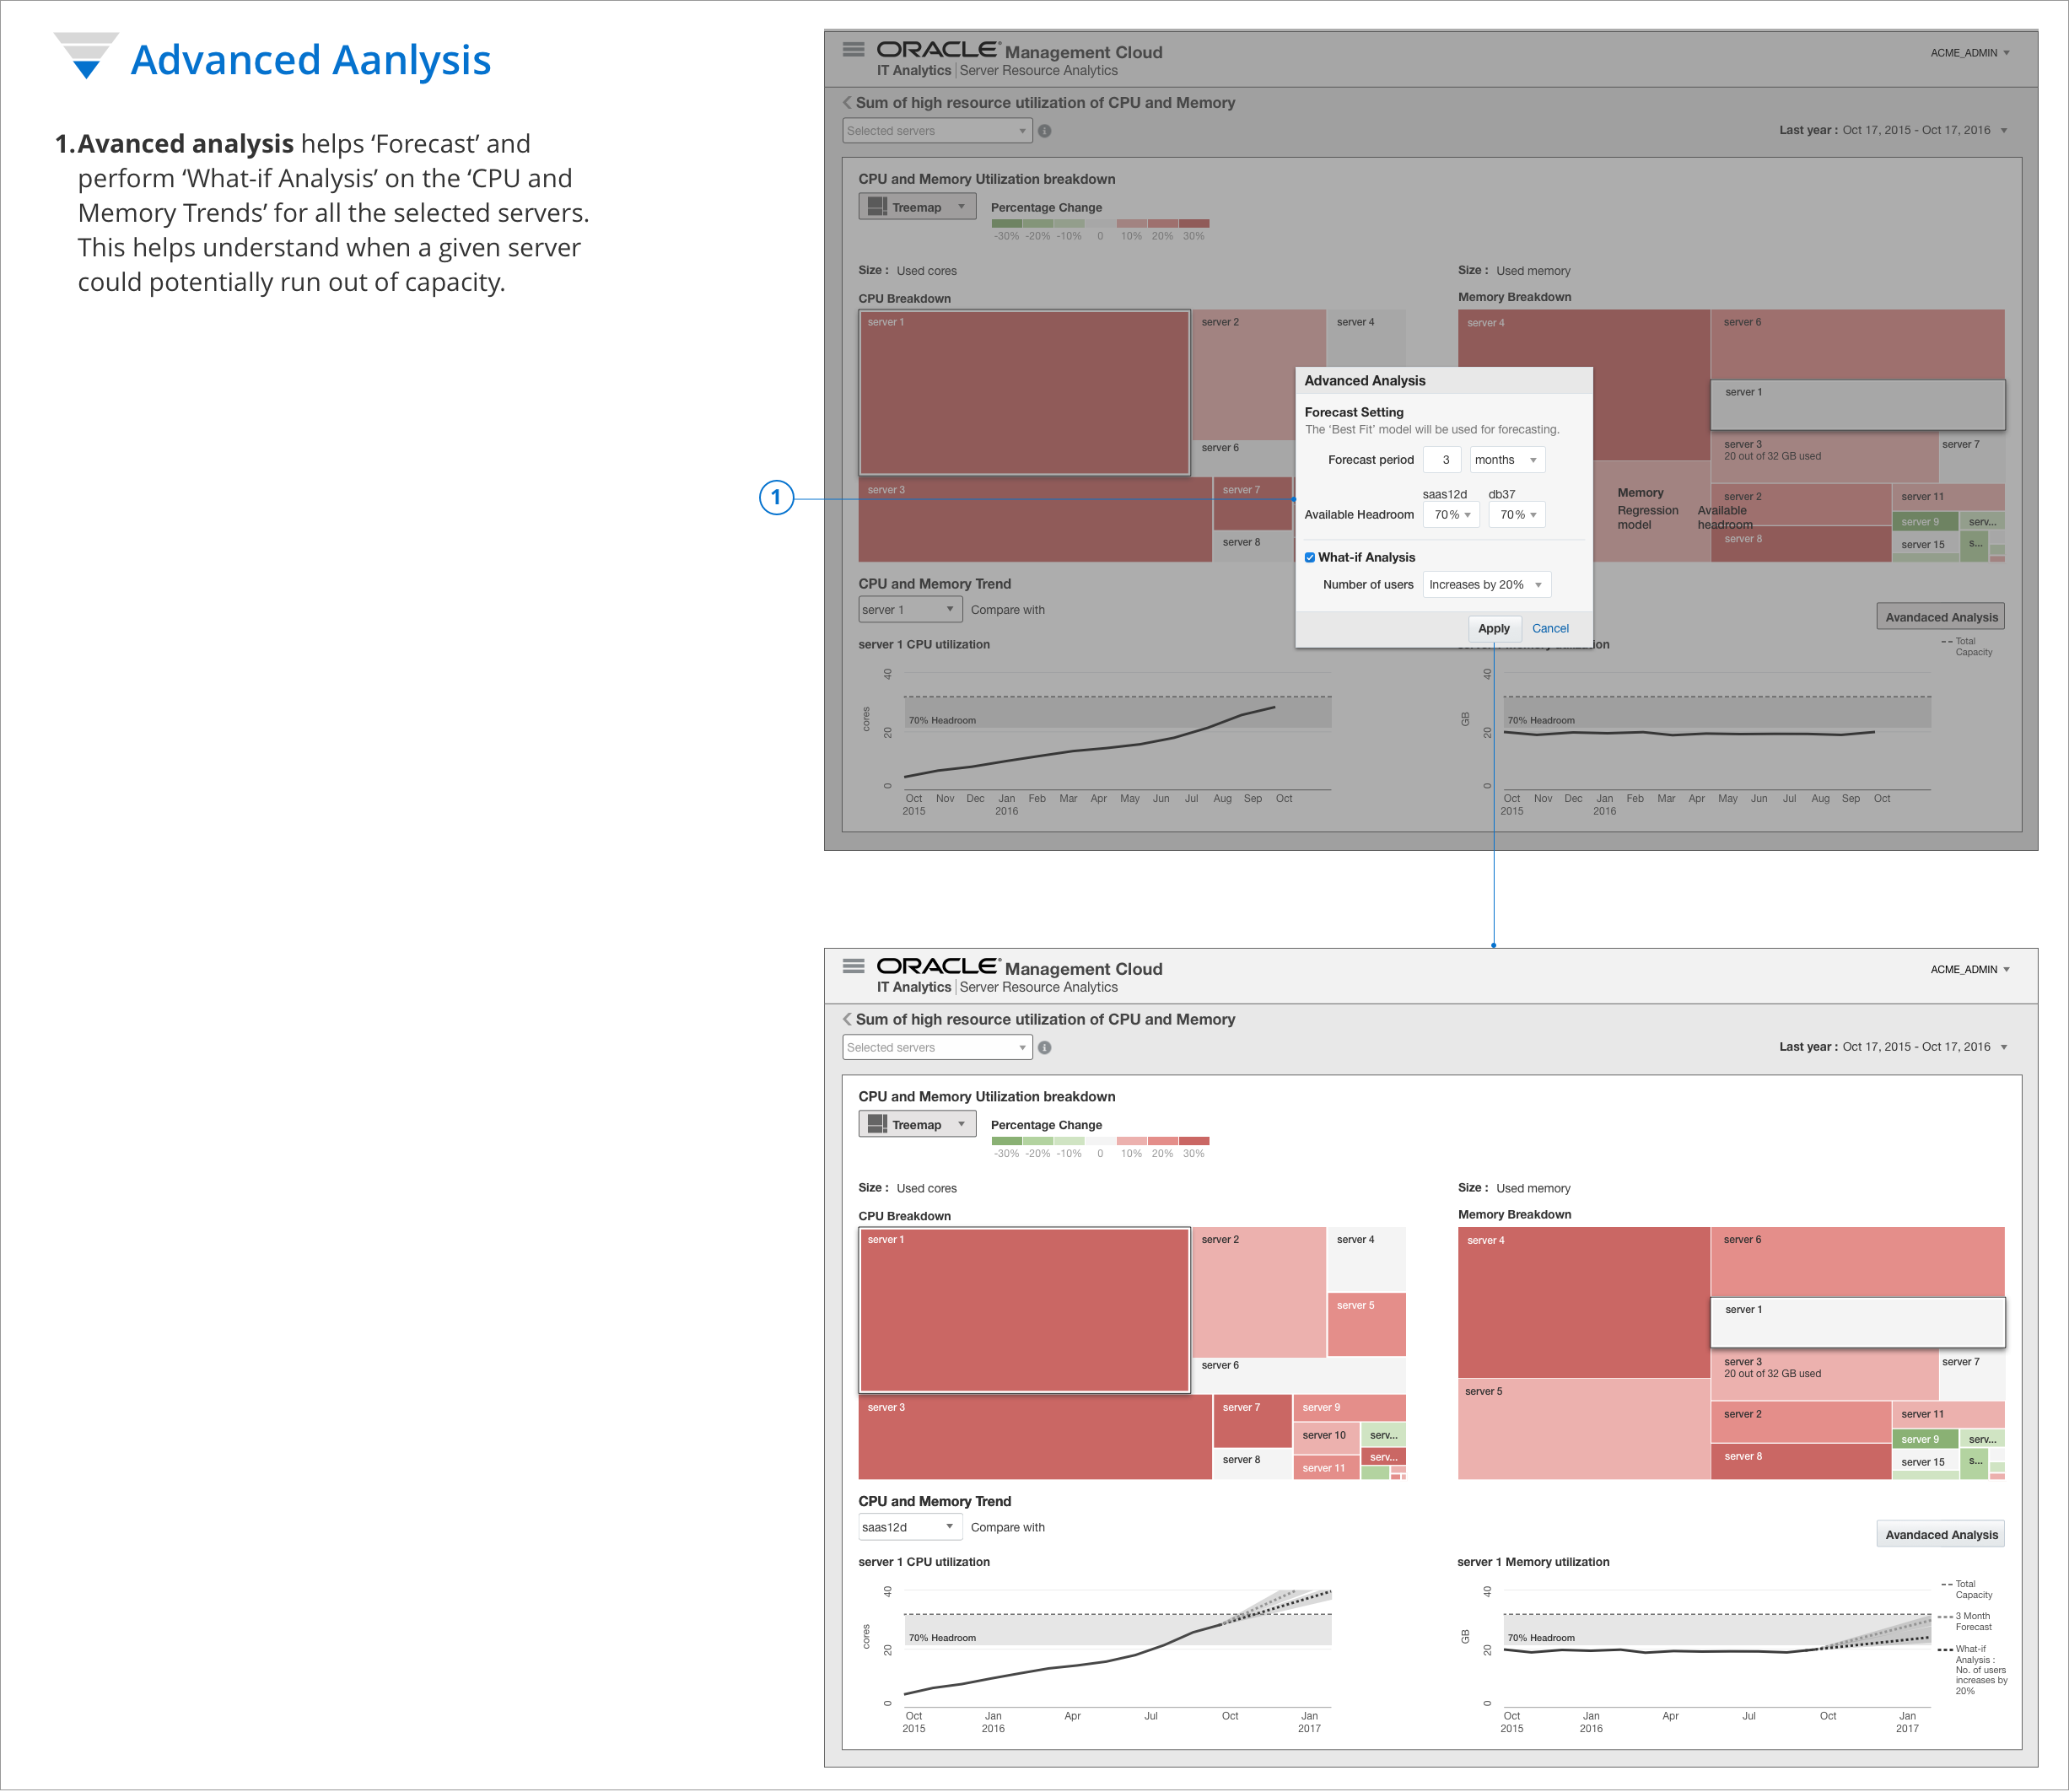
Wireframes that carried the structure through.
The wireframes evolved through several iteration rounds, but the underlying information architecture held all the way to final.
Impact
Well received, and quietly influential.
-
Customer reception
Landed with real server estates.
The application was well received by customers managing large, messy server estates, the very audience the redesign was tuned for.
-
Patterns beyond one app
Adopted across the platform.
Several interaction patterns from this work were adopted across the broader Oracle Management Cloud platform.
Reflections & design takeaways
Understand the content. The hardest part of this project wasn't the pixels; it was the vocabulary. To design a simple experience, I had to genuinely understand the use cases and the terminology underneath them. There's no shortcut for that.
Collaboration is the fastest path. On problems this technical, the quickest route to the right solution is tight collaboration with PMs, engineers, and domain experts. That partnership was the single biggest reason the experience landed where it did.